
An alert fires at 2 AM. Core checkout latency is spiking, payments are timing out, and customer support tickets are rolling in.
Your first instinct might be to dive headfirst into millions of raw application logs. But senior engineering leaders take a different approach. Instead of guessing, they systematically narrow down the failure domain to restore stability within minutes.
This step-by-step guide walks you through a practical incident triage protocol that you can apply during high-severity production outages.
What Is Incident Root Cause Analysis?
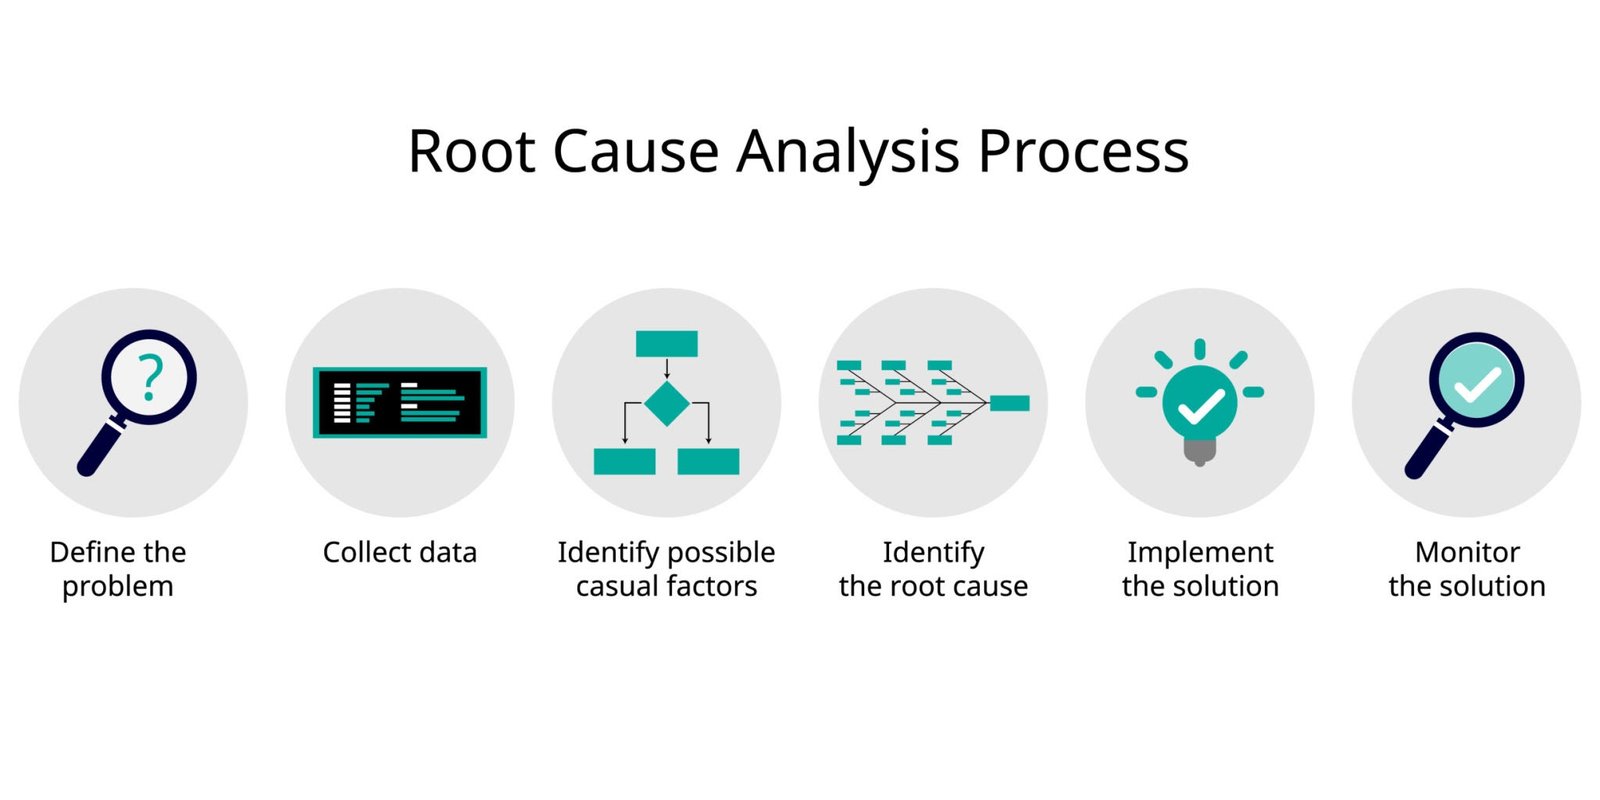
Incident Root Cause Analysis (RCA) is a structured problem-solving process used to identify the primary cause of a system failure or performance degradation. Rather than just fixing the immediate symptoms, an RCA pinpoints the underlying technical or procedural trigger so teams can prevent the issue from recurring.
The 4-Step RCA Sequence
When production degrades, follow this strict four-stage diagnostic sequence to isolate the issue:
- Change Audit: Identify what changed in the system recently.
- Layer Isolation: Pinpoint which application layer is failing.
- Blast Radius: Determine who and what is affected.
- Remediation: Decide whether to rollback or fix forward.
Step 1 : Audit Recent Changes (The 90% Rule)
Over 90% of sudden production incidents stem from an explicit operational change rather than hardware failure or organic traffic growth. Before digging through millions of lines of raw logs, inspect the operational changes made in the preceding two hours across five key risk areas.
Why Operational Changes Drive Outages
Software servers rarely fail spontaneously without human intervention. Think of a production system like a healthy individual who suddenly collapses at 2 PM. Most of the time, the issue is tied to something consumed an hour earlier rather than an underlying illness.
In production environments, almost every sudden crash happens because someone pushed an intentional change. When an outage strikes, asking who touched what in the last 120 minutes isolates the culprit faster than manual log inspection.1. Code Deployments (The “Quick Fix” Trap)
Releasing software updates, hotfixes, or microservice patches is the leading cause of sudden instability. For example, a developer deploys an update at 4:30 PM to fix a typo on the checkout page. Tucked inside that build was a minor code error that breaks the payment confirmation button, preventing thousands of shoppers from placing orders.
Before shipping new builds, ensure your team aligns with our system design architecture guide to isolate failure domains before code reaches production.
2. Feature Flags (The “Flipped Switch” Trap)
Turning a feature on or off via an admin panel without deploying new code can trigger massive traffic shifts. For example, a product manager flips a feature flag switch to roll out an AI recommended products bar to 50% of active users.
No new code went live that day, but that single recommendation bar generates 20 database queries per second per active user, instantly overwhelming the database cluster. Implementing proper feature flag management strategies prevents unmonitored feature toggles from overloading core infrastructure.
3. Database Updates (The “Housekeeping” Trap)
Modifying database schemas, dropping indexes, or clearing application caches alters query execution paths. For example, a database administrator deletes an secondary index assuming it represents unused storage space.
Five minutes later, every product search query transitions from a 50-millisecond index lookup to a 12-second full table scan across millions of rows, locking database connections.
4. Infrastructure Adjustments (The “Tweak the Pipes” Trap)
Adjusting network routing tables, cloud auto-scaling policies, or ingress controllers impacts live traffic paths. For example, a DevOps engineer modifies a load balancer routing rule to optimize cloud hosting costs.
A minor routing misconfiguration causes 20% of incoming mobile API requests to route to an uninitialized server pool, generating immediate connection drops for mobile users.
5. Third-Party Dependencies (The “Not My Code” Trap)
External APIs, payment processing gateways, and SaaS vendors fail independently of your internal infrastructure. For example, your application code, database, and cloud servers run with zero local modifications.
However, your third-party payment gateway deploys an unannounced API update on their end that stalls response times. Your checkout endpoints hang indefinitely waiting for external socket responses, causing cascading timeouts across your frontend applications.
When an outage strikes, asking who touched what in the last 120 minutes isolates the culprit faster than any log reader ever will.
Step 2: Isolate the Failing Layer via the 4 Golden Signals
Isolate the exact failing layer, whether it is the application, database, network, or an external dependency, before reading application code.
When a car breaks down on the highway, you do not instantly tear open the engine block to check every single screw. You check the dashboard gauges first: Is the fuel tank empty? Is the engine overheating? Is the battery light flashing?
Google’s 4 Golden Signals are the dashboard gauges for software systems. They tell you which part of the system is failing before you waste time hunting through millions of lines of code logs. Here is how to read those four dashboard gauges in simple terms:
1. Latency (How long are people waiting?)
Latency is speed. It measures how many milliseconds it takes from the moment a user clicks a button to when the page actually loads.
Imagine 100 people standing in line at a coffee shop. The p50 metric is the experience of the typical person in the middle of the line (the 50th person). The p99 metric is the experience of the single unluckiest person at the very back of the line (the 99th person).
If the middle person (p50) gets their coffee in 1 minute, but the unluckiest person (p99) waits 10 minutes, the coffee shop is not broken. There is just one tricky order holding up one person, such as a slow database lookup for a user with a massive account history. However, if everyone from person 1 to person 100 is suddenly waiting 10 minutes, the whole espresso machine is clogged.
2. Traffic (How many people are knocking on the door?)
Traffic measures how much work your system is being asked to handle at any given second in Requests Per Second.
If a normal number of customers walk into a restaurant, but food takes 45 minutes to arrive, the kitchen staff is stuck, slow, or struggling with an internal code or database bug. But if three surprise tour buses pull up and dump 300 customers at once, food is slow simply because the kitchen is overwhelmed by a traffic surge, viral marketing campaign, or bot attack.
3. Errors (What is actively throwing a red flag?)
When something fails, the system leaves a specific error code that tells you how it broke.
For an HTTP 504 Gateway Timeout, picture a waiter who went to the kitchen to get your food, waited 5 minutes, and came back to say that the kitchen is taking too long, so he had to give up. The database or app is running, but frozen or moving at a crawl.
For an HTTP 502 Bad Gateway, picture a waiter who walked into the kitchen and found the chef passed out on the floor with the stove turned off. The application process completely crashed or went offline.
4. Saturation (How full is the gas tank?)
Saturation measures how close your server resources are to hitting 100% capacity. Understanding these resource constraints is a fundamental concept in cloud infrastructure observability.
Every server has a fixed amount of memory, processor power, and database connection slots. If your database connection capacity hits 100%, it is like a parking lot with zero open spots left where cars are trapped outside lining up on the main street waiting for one car to leave. If CPU and memory hit 100%, the server is suffocating and unable to process a single new request.
Step 3: Evaluate the Blast Radius
Understanding the scope of an outage helps you route triage efforts without causing unnecessary downtime for unaffected users.
When an explosion happens in a movie, bomb experts immediately measure the blast radius. They want to know if the blast blew up one room, an entire building, or a whole city block. Evaluating the blast radius in software means answering one core question: How big is the damage, and who is actually suffering right now?
Knowing this stops you from overreacting. If a small fire starts in a hotel kitchen, you put out the kitchen fire. You do not evacuate the entire city.
1. Global versus Segmented (Is everyone affected, or just a specific group?)
Imagine a major airline. If their central reservation system crashes, flights all over the world are grounded. That is a global failure.
Now imagine only passengers trying to book a flight using a specific promo code on an Android phone in London get an error. Everyone else buying normal tickets on laptops in New York is totally fine. That is a segmented failure.
If you discover a bug only affects a small group, such as users on an old app version in one country, you do not take down the website for the rest of the world. You isolate the problem and fix it for that specific group.
2. P99 versus P50 Isolation (Is everyone stuck, or just the unluckiest few?)
Think back to the coffee shop line. If 95 out of 100 customers walk out with their coffee in 30 seconds, but 5 people ordering complex custom drinks wait 4 minutes, the coffee shop is running smoothly for almost everyone.
In tech terms, p50 represents the typical user in the middle, while p99 represents the unluckiest 1 percent of users at the back of the line.
If your metrics show that p50 latency is fast at 120 milliseconds, but p99 latency spikes to 4,500 milliseconds, 95 percent of your customers are having a great experience. Only 5 percent are seeing delays. Instead of hitting the panic button and taking down your entire website for emergency maintenance, you simply turn off the single feature switch or route causing that delay for the unluckiest 5 percent. The rest of your users keep using the product normally while you fix the issue behind the scenes.
Step 4: Decide to Rollback or Fix Forward
During an active outage, avoid debating complex code fixes. When a system is crashing, your priority is to stop the bleeding, not to show off your debugging skills. Attempting to write complex code while customers are getting errors is like trying to repair an airplane engine while the plane is in mid-air.
You have two options when a new release breaks production:
- Rollback: Hit the undo button to instantly restore the last working version of your app.
- Fix Forward: Keep the broken version live while you quickly deploy a patch over it.
During a major incident, team leads should follow real-time incident response playbooks and apply our technical tradeoff analysis framework to weigh downtime costs against fix complexity. Follow these three clear rules:
Rule 1: If you are guessing, hit the undo button immediately
Imagine a plumber fixing a burst pipe in your house. If water is flooding your living room and the plumber says they are not sure which valve is leaking and want to try replacing random parts, you would tell them to turn off the main water valve first.
In software, if you do not know the exact cause of the outage within two minutes, do not attempt to write code or debug live on production. Hit the rollback button to restore the working version, stop the flooding, and debug the problem safely on your computer.
Rule 2: If the fix takes longer than 5 minutes to go live, hit the undo button
Suppose you realize a single mistake in your code is causing the crash, but compiling and deploying a fix takes 20 minutes. Every minute your system stays broken, you lose money and trust. A rollback usually takes under 60 seconds. Even if you know how to fix the bug, hit the undo button if deployment takes longer than 5 minutes so your users get immediate relief.
Rule 3: Only fix forward if the change is tiny, verified, and lightning fast
You should only attempt to fix forward if three strict conditions are met at the same time:
- You are 100 percent sure what broke.
- The fix is as simple as changing one line of code or flipping a single setting.
- The pipeline can deploy that change to production in under 5 minutes.
If any single one of those three conditions is missing, default to a rollback.
Real-World Case Study: Debugging a Database Timeout
The Incident
At 10:15 AM, an e-commerce API gateway began throwing HTTP 504 gateway timeouts on the primary checkout endpoint.
The Triage Walkthrough
- Change Audit: The team discovered that release v2.1.0 was deployed 8 minutes before the first alert.
- Layer Isolation: Application CPU usage remained low at 18%, but database connection pool saturation hit 100%.
- Root Cause: Release v2.1.0 introduced an unclosed database query inside a processing loop, rapidly exhausting available connections.
- Remediation: The on-call engineer executed an immediate deployment rollback to v2.0.9. Connection pool saturation dropped back to 15% within 45 seconds, restoring full service.
Free Incident Post-Mortem Template (CAPA Framework)
After resolving an outage, teams should document findings using incident post-mortem best practices. Copy and paste this mobile-friendly markdown template into your engineering documentation tool to record incident findings using the Corrective and Preventive Actions (CAPA) framework:
Markdown
# Incident Post-Mortem: [Service Name]

## Incident Metadata
* Date: YYYY-MM-DD
* Severity: SEV-1 / SEV-2
* Time to Detect (TTD): X minutes
* Time to Resolve (TTR): Y minutes
* Impacted Area: 12% of checkout requests failed due to HTTP 504 timeouts

## Trigger & Root Cause
* Primary Trigger: Unclosed ORM connection inside processing loop in release v2.1.0
* Failing Layer: Database Connection Pool

## Action Items (CAPA)
* Preventive Action: Add automated static code analysis rule to catch unclosed database connection handles during CI build stage. (Owner: Backend Team | Target: Sprint 24)
* Observability Action: Lower database connection pool saturation alert threshold from 90% to 80% for early warning. (Owner: SRE Team | Target: Immediate)
* Testing Action: Add automated integration load tests to verify connection pool cleanup under high traffic. (Owner: QA Team | Target: Sprint 25)
To ensure your team eliminates recurring infrastructure issues before shipping next time, run every release through our non-functional requirements checklist. When recurring incidents trace back to fragile legacy components, use our technical debt management strategy to quantify risk and gain leadership support for refactoring.
Product Architecture Learning Path
- System Design: Build resilient microservices from scratch.
- Tradeoff Analysis: Evaluate architectural risks and reversal costs.
- RCA Playbooks: Triage live production outages in real time.
- NFR Checklists: Verify performance, scalability, and security gates before launch.
- Tech Debt Strategy: Measure, prioritize, and pay down architectural debt.
Frequently Asked Questions (FAQs)
What is the difference between a root cause and a contributing factor?
A root cause is the fundamental technical or procedural failure that directly triggered an incident, which, if removed, prevents recurrence. A contributing factor is a secondary condition, such as missing alert thresholds or insufficient logging, that made the incident worse or harder to detect, but did not cause it directly.
Should you rollback or fix forward during a production incident?
You should rollback immediately if the root cause is uncertain, the deployment pipeline takes longer than five minutes, or the issue affects core critical user paths. You should only fix forward if the root cause is completely verified, the fix is extremely simple like a flag toggle, and deployment takes under five minutes.
What are Google’s 4 Golden Signals in SRE?
Google’s 4 Golden Signals for monitoring distributed systems are Latency, Traffic, Errors, and Saturation. Tracking these four metrics helps engineering teams quickly identify which layer of an application is failing during a production outage.
How quickly should an incident post-mortem be completed?
An incident post-mortem should be drafted within 24 to 48 hours of resolving a SEV-1 or SEV-2 incident. Completing it quickly ensures that system context, timeline details, and telemetry data remain fresh in the minds of the engineering team.
How does incident root cause analysis connect to long-term system architecture?
Incident root cause analysis feeds directly back into your long-term system design and product architecture. Every post-mortem identifies gaps in non-functional requirements and technical debt, turning live failure data into actionable engineering priorities for future sprint planning.